
Imaging spectrometry
Experiment name:
Exploitation of satellite imaging spectrometry for mapping phytoplankton and aquatic vegetation
Scientific question:
Can current imaging spectrometry enable the assessment of primary producers in freshwater reservoirs?
Experiment idea:
The idea is to explore current imaging spectrometry data (e.g. PRISMA, DESIS) in order to describe in terms of pigments, size classes, and functional traits the primary producers in selected target areas (e.g. WTP Melbourne).

Claudia GIARDINO
[email protected]
Mariano BRESCIANI
[email protected]
Alice FABBRETTO
[email protected]
Salvatore MANGANO
[email protected]
Andrea PELLEGRINO
[email protected]

Janet ANSTEE
[email protected]
Background information
The provision of primary producers for freshwater systems represents a challenge that can be properly met with hyperspectral data. With regard to the challenge of these surface waters, we refer to: optical complexity (i.e. non-covarying water constituents), the complexity of the atmosphere (notably, the aerosols present) the influence of bottom reflectance on the signal in optically shallow waters. This experiment aims to exploit imagery acquired by the current hyperspectral satellite sensors (i.e. PRISMA and DESIS and potentially EnMap, to be launched in 2021), by undertaking image-processing steps necessary to tune satellite data into ecological products. Current hyperspectral satellite sensors PRISMA and DESIS might hence offer improved data for investigating primary producers of freshwater reservoirs but since they have not designed as aquatic missions an evaluation of data has to be performed.
Leader
CNR
Short Description
Search and download of existing data from the portals; tasking of new acquisitions.
Completed
A first set of imagery will be available in Sep. 2020 (but this is an ongoing task, until the end of the project)
Outcome
PRISMA and DESIS imagery data are provided at two different processing levels by the Italian (ASI) and German (DLR) Space Agencies, respectively. Overall, Level 1 (L1) products are imagery data in physical terms of Radiance, measured at Top of Atmosphere (TOA), while the Level 2 (L2) products, obtained after an automatically atmospheric correction provided by sensors, of the L1 products, are images in terms of Reflectance, measured at the Bottom of Atmosphere (BOA). The following tables shows the available dataset for the PrimeWater study areas; all images were downloaded from PRISMA portal (http://www.prisma-i.it/index.php/en/) and DESIS portal (https://eoweb.dlr.de/egp/). Through the PRISMA portal there is also the possibility to plan a new acquisition over an area of interest to the user, by setting the coordinates and the maximum acceptable cloud coverage. In addition, there is the opportunity to use a very useful tool, the PRISMA pre-feasibility tool (http://90.147.170.162/), developed by ASI, which allows to verify future PRISMA passes over the area of interest, in the required time interval, according to the PRISMA orbits.
Video 1 – PRISMA download
Video 2 – DESIS download
The format adopted for DESIS products is “GeoTIFF”, so once downloaded, the products are immediately usable. Instead, PRISMA products are downloaded in a Hierarchical Data Format (HDF5). To obtain a more user-friendly format, they need to be converted by using the Prismaread R package developed at CNR
( https://github.com/ranghetti/prismaread )
Video 3 – Prismaread
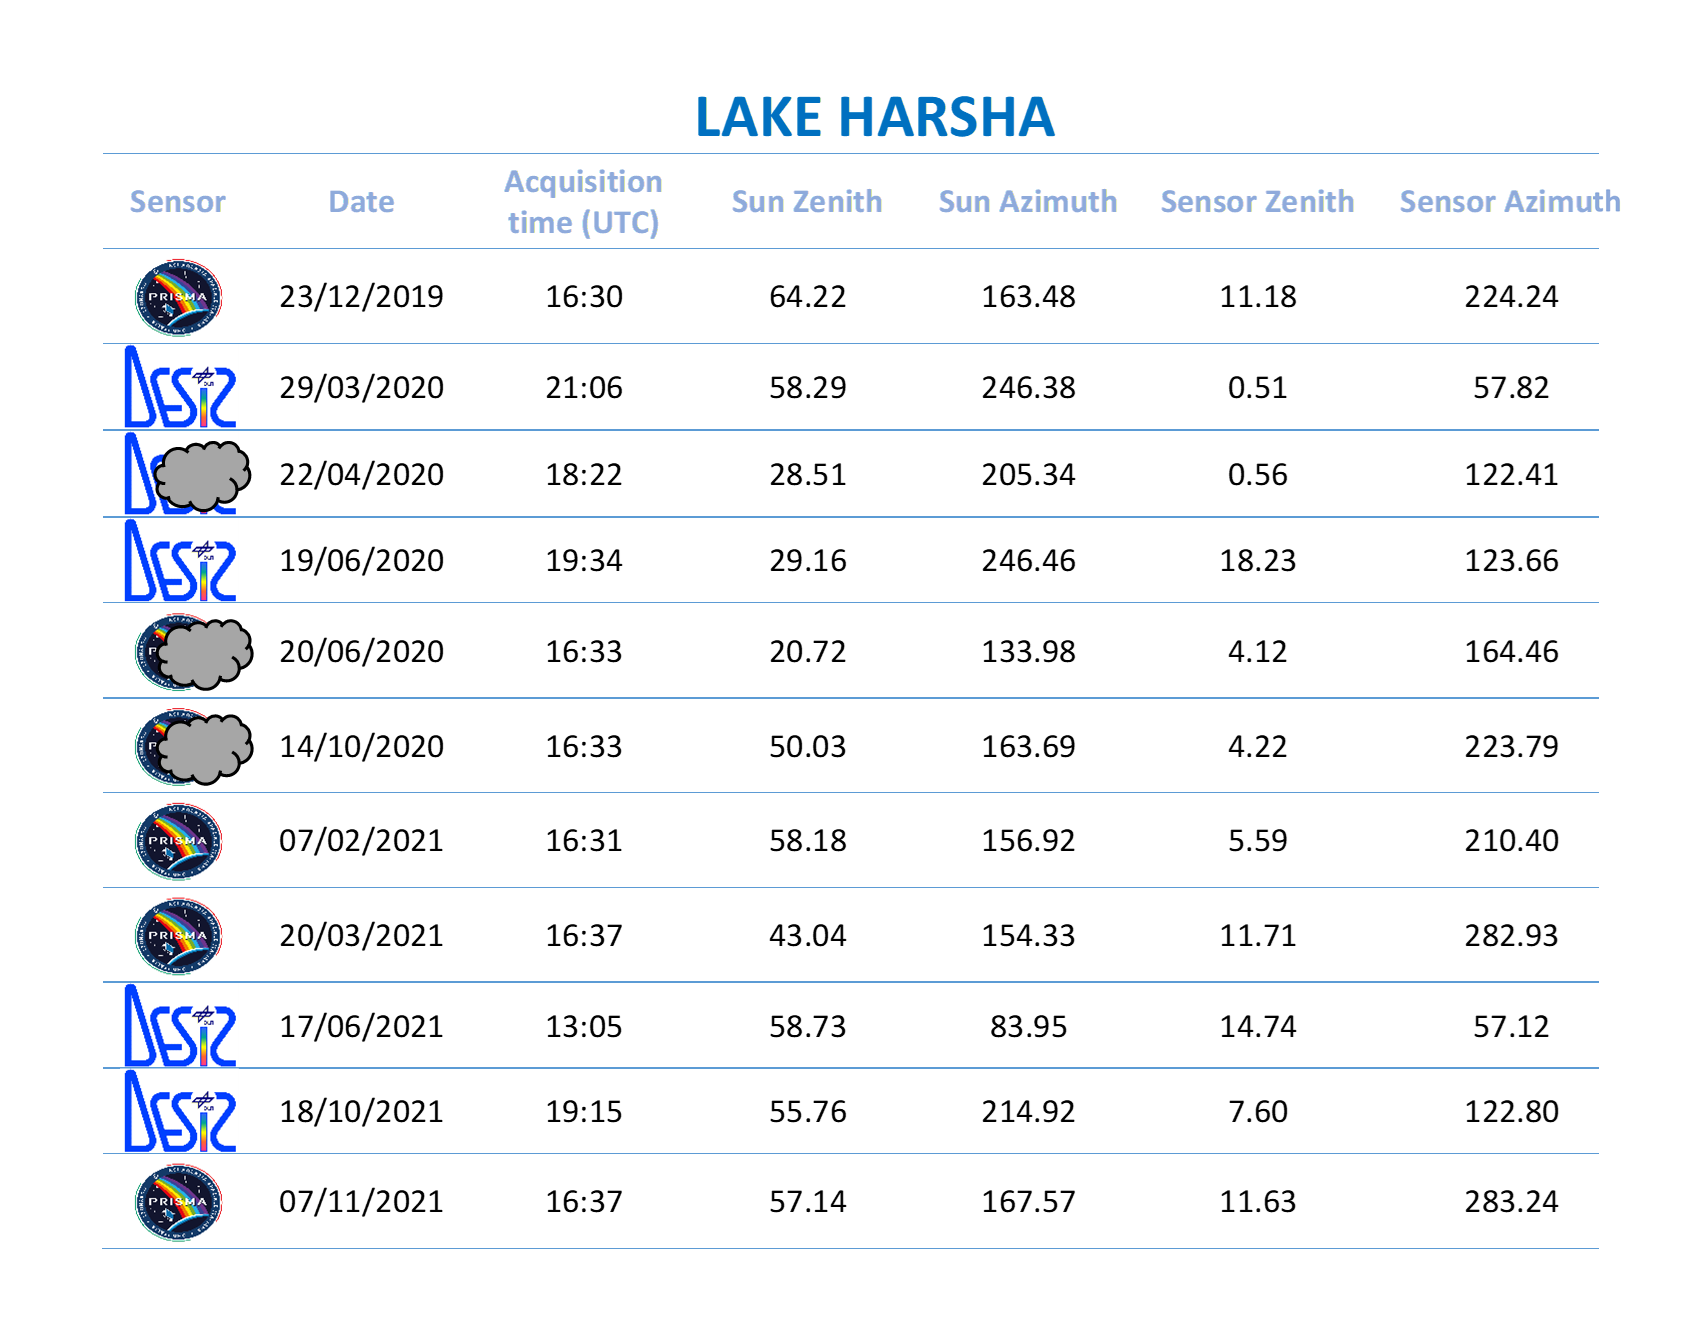
Figure 1 – Dataset Lake Harsha
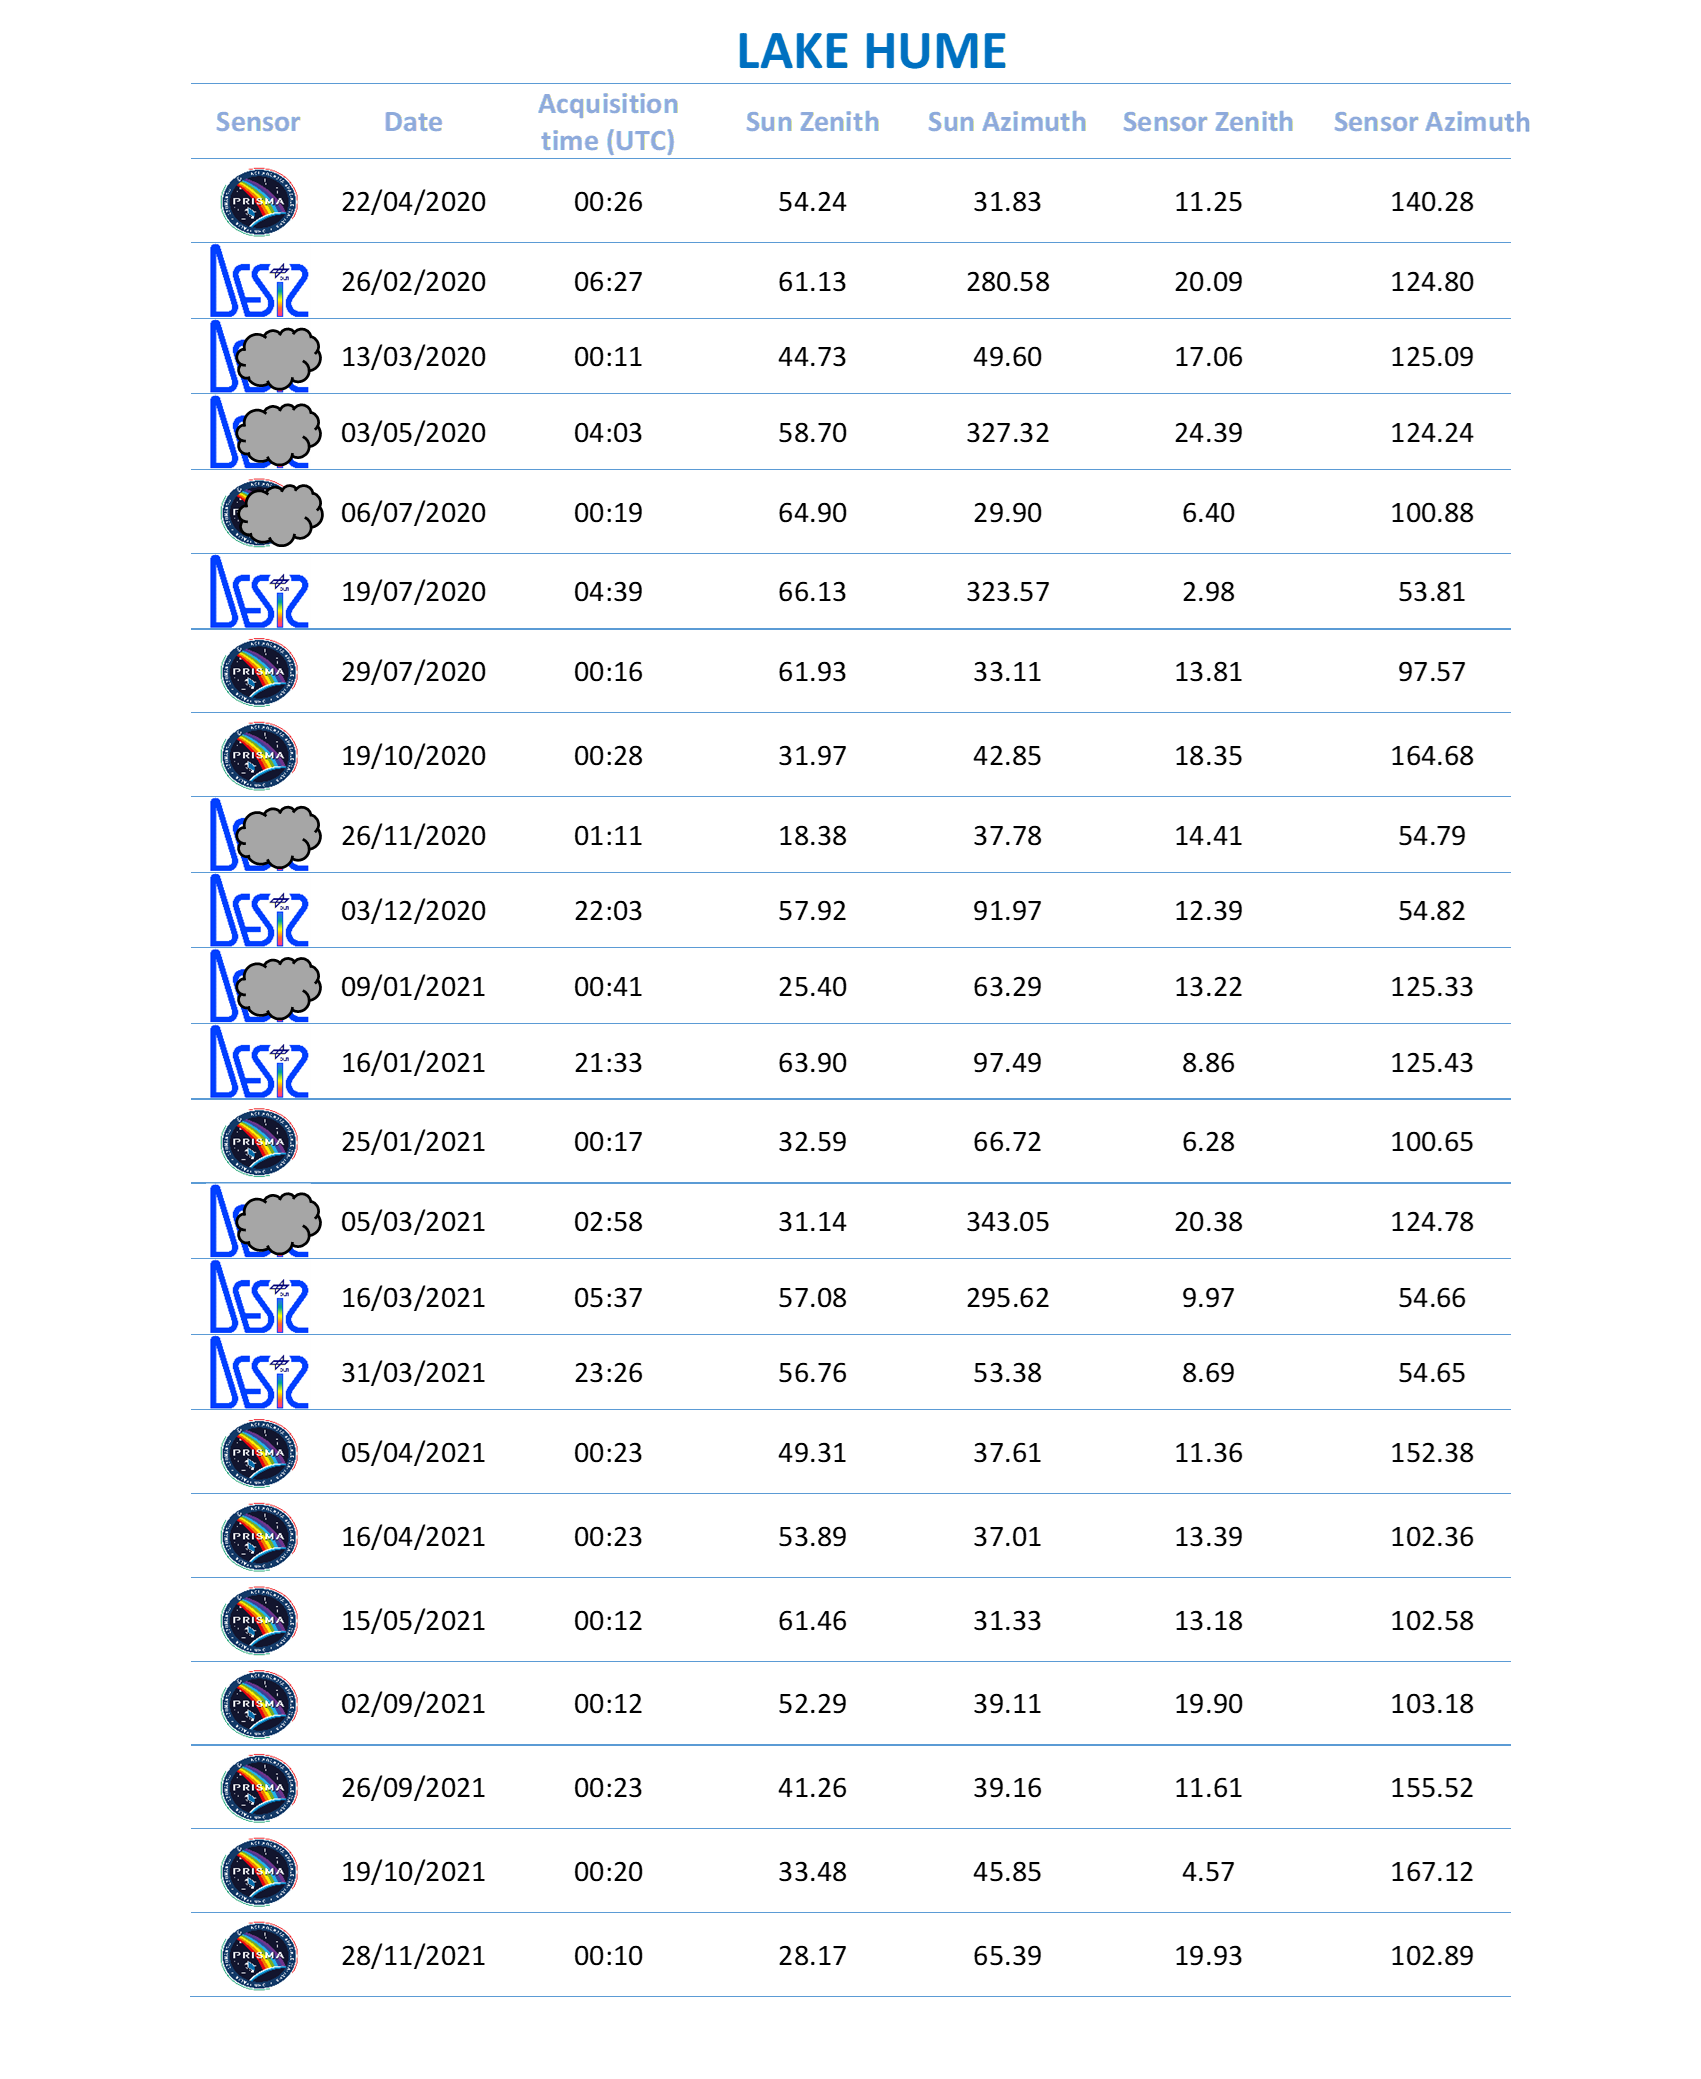
Figure 2 – Dataset Lake Hume
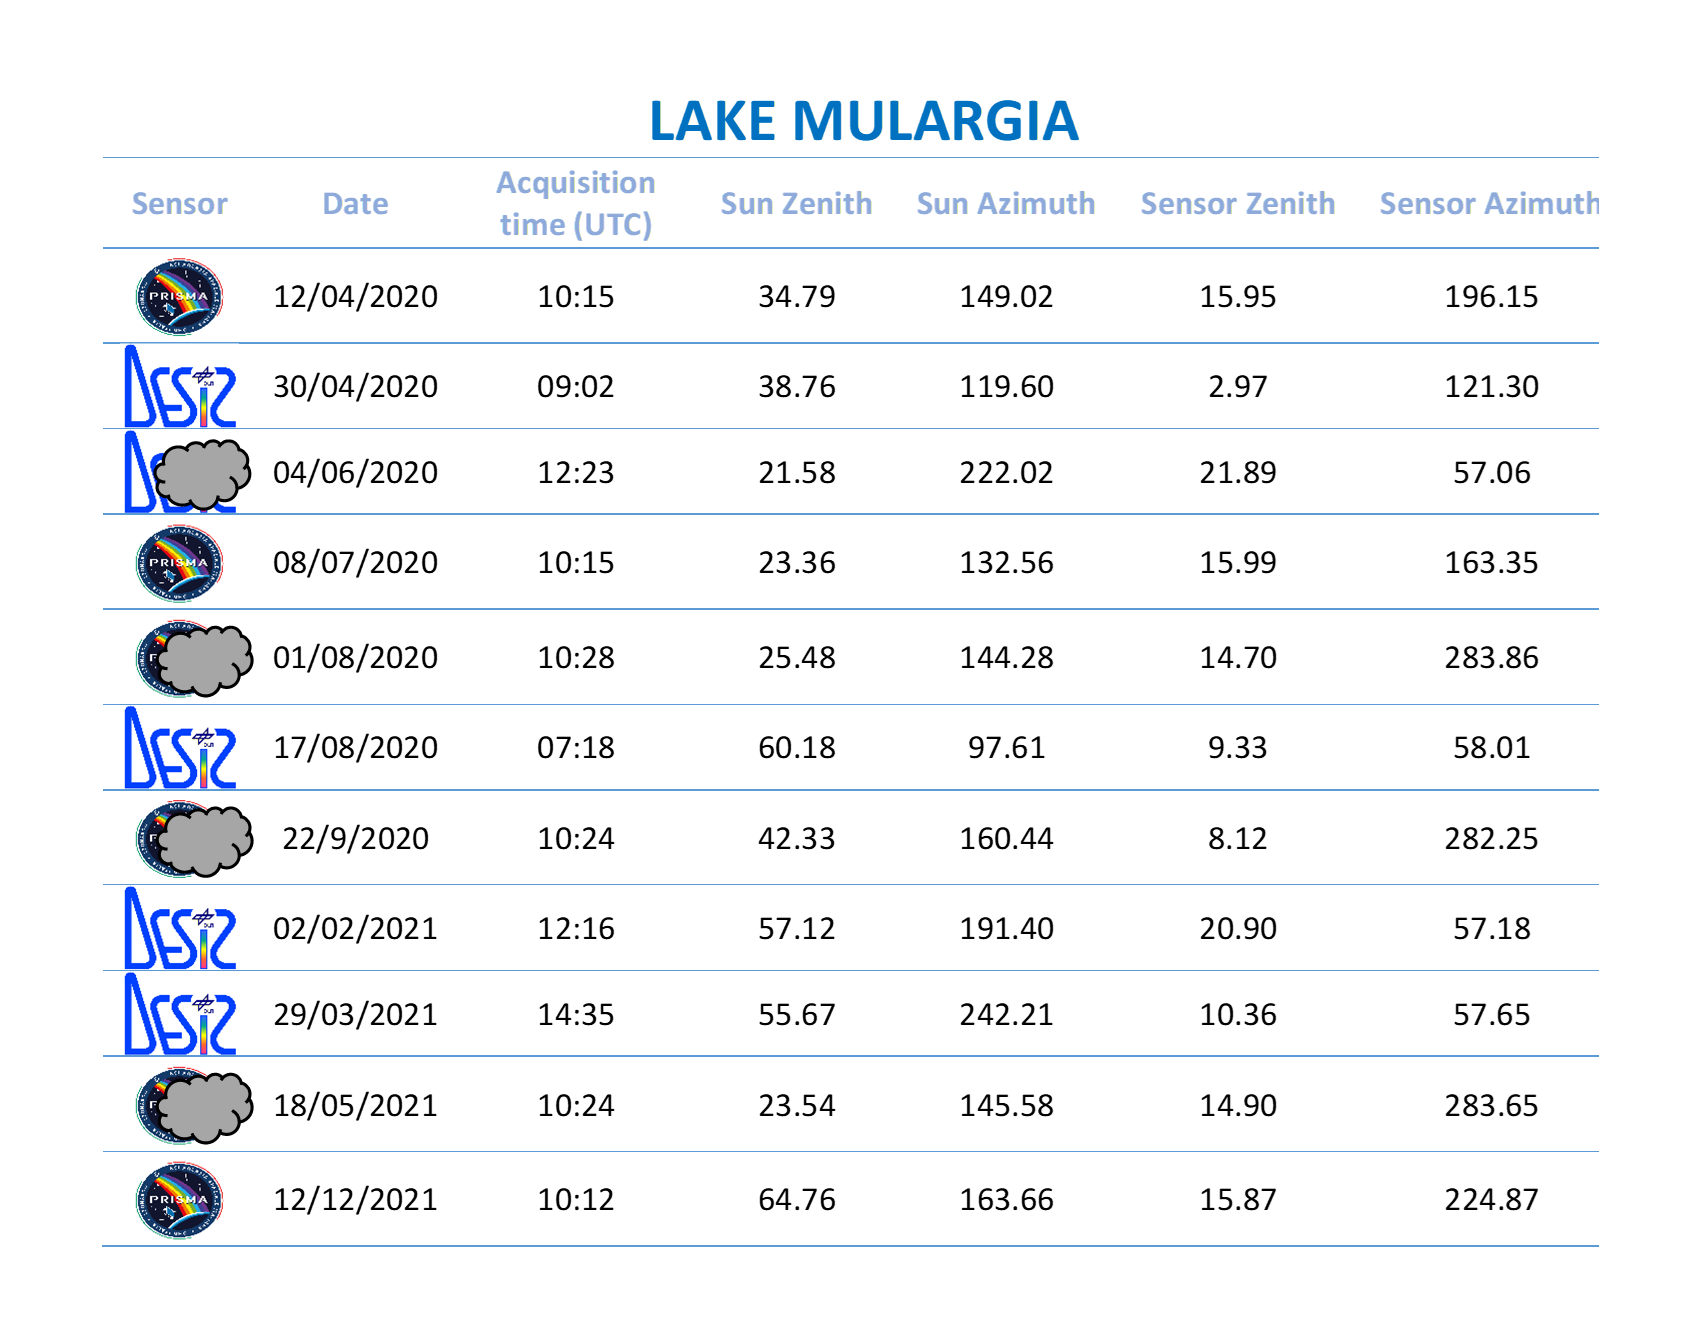
Figure 3 – Dataset Lake Mulargia
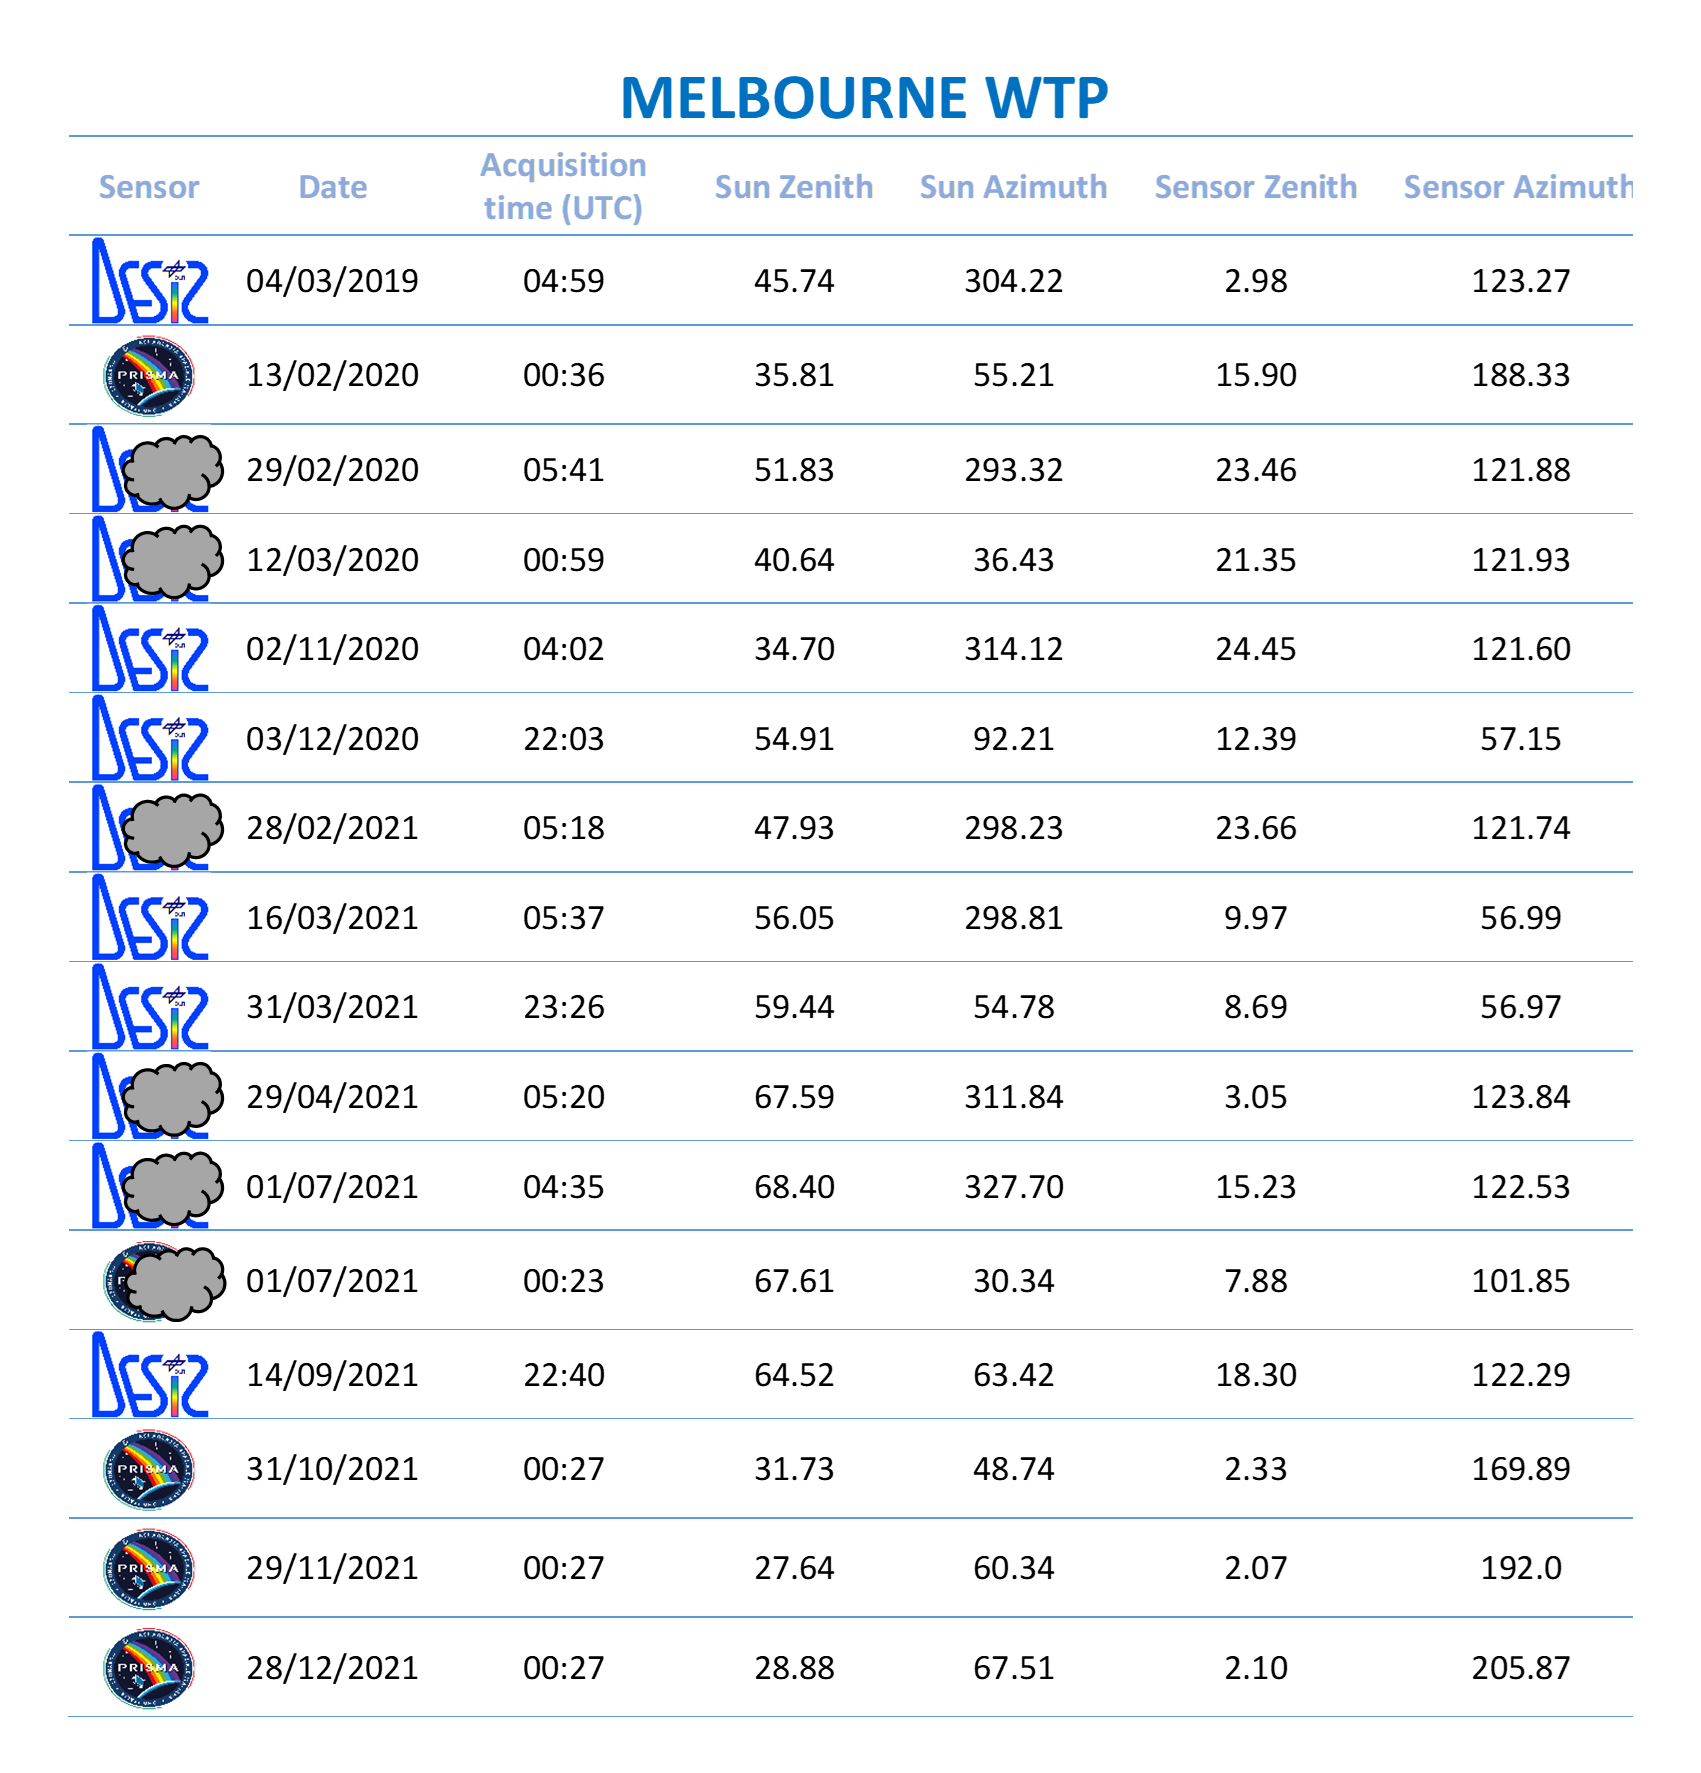
Figure 4 – Dataset WTP Melbourne
Leader
CSIRO
Short Description:
Collection of in-situ data to be used as reference of satellite imagery
Completed
May 2022 (but this is an ongoing task, until the end of the project)
Outcome
In order to validate PRISMA and DESIS data, several in-situ measurements were collected from AERONET-OC network (Zibordi et al., 2004) and WISPStation (Peters et al., 2018) in Lake Trasimeno (Italy). In-situ data were provided in terms of Reflectance remote sensing (Rrs), which is the physical quantity mainly used for the recovery of water quality parameters, such as Chlorophyll-a (Chl-a) concentration, Suspended Particulate Matter (SPM), Colored Dissolved Organic Matter (CDOM), transparency and others. Rrs is defined as the ratio of the Radiance released by the water (Lw) to the downwelling irradiance (E0), expressed in terms of steradian (sr-1).
The AERONET (AErosol RObotic NETwork) project is a federation of ground-based Remote Sensing aerosol networks established by NASA and PHOTONS (PHOtométrie pour le Traitement Opérationnel de Normalisation Satellitaire; Univ. of Lille, CNES, and CNRS-INSU). The network component called AERONET-Ocean Color (AERONET-OC) provides the additional capability of measuring the radiance emerging from the water (i.e., water-leaving radiance) with CE-318 sun-photometers installed on offshore platforms ( https://aeronet.gsfc.nasa.gov/new_web/ocean_color.html ) worldwide distributed (next Figure).
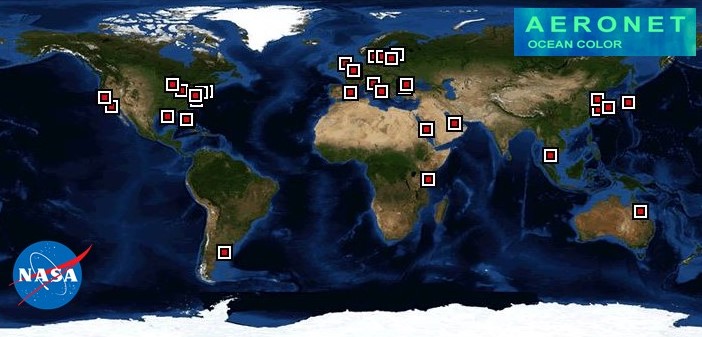
Figure 5 – AERONET-OC map
The AERONET-OC spectra were characterized in terms of Optical Water Types (OWTs), according to Wei et al. (2016), in order to distinguish the clearest from the most turbid waters. The resulted characterization is shown in the Figure below.
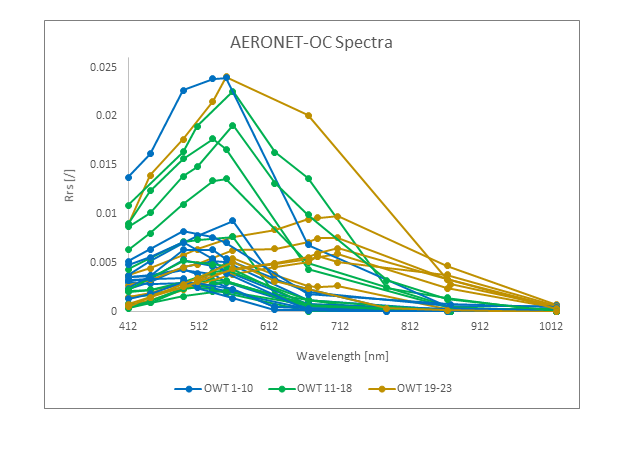
Figure 6 – AERONET-OC Spectra characterization
The WISPStation is an autonomous radiometer system, it is located 400 m from Isola Polvese, in Lake Trasimeno (Bresciani et al., 2020) (next Figure). The radiometers measure radiance and irradiance in the spectral range of 350–900 nm with a high spectral resolution (average bandwidth = 4.6 nm) and a high temporal resolution (it takes measures every 15 minutes). The WISPStation contains two sets of sensors: the set that is best oriented with respect to the sun position at any time of the day is automatically selected in the backend WISPcloud. This instrument setup allows the minimization of the amount of sun and sky glint in the measurement.
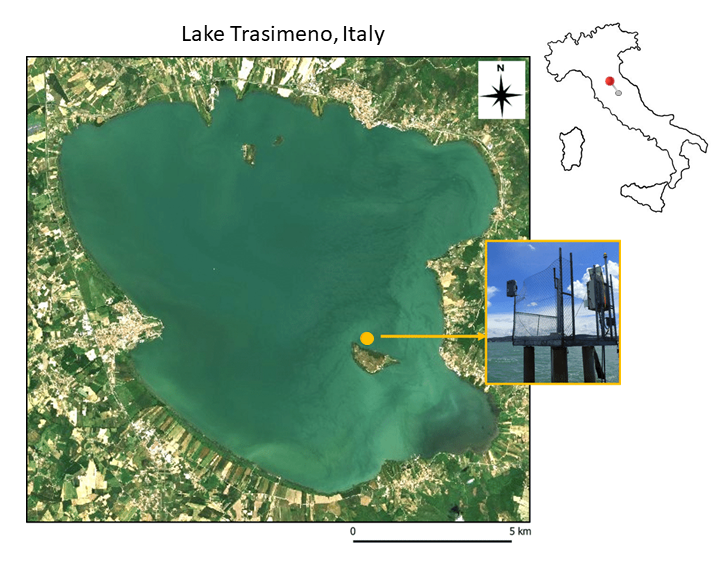
Figure 7 – WISPStation
Leader
CNR
Short Description
6SV code-based simulation of TOA reflectance/radiance from reference in situ data for the days matching the satellite observations
Completed
May 2022 (depending on further acquisitions of satellite imagery this is an ongoing task, until the end of the project)
Outcome
This task aims to present two different codes for Data preparation.
The first code makes uses of the 6Sv radiative transfer code (Vermote et al., 1997; Kotchenova et al., 2006; 2007) designed to simulate TOA Radiance and TOA Reflectance data, starting from BOA Reflectance data, as well as to run the inversion process for the atmospheric correction. The result represents the data that could be measured by a sensor, positioned with certain angles, at a certain time of the day and with certain atmospheric conditions: in facts, the code needs all these data as input information. This code ( https://drive.google.com/drive/folders/1SWsSjCNIjH2koCLBm1qT0uvliT7wE-KT?usp=sharing ) was developed and used for the simulation of in-situ data, so that Radiance measurements could be obtained and comparisons of L1 with other sensors could be made. Originally the in-situ data provided were in terms of Reflectance.
Video 4 – Simulation of in-situ data
The second code (written in IDL https://drive.google.com/drive/folders/1f2sieQ5HbNrhHkhpvRQu6bpRomAVWqta?usp=sharing ) is applied to DESIS L1 data to convert TOA Radiance data into TOA Reflectance data (a similar code is available also for PRISMA https://drive.google.com/drive/folders/1zH-5CrEkE4zQtGlaKDr_TMPw75ID78fS?usp=sharing ). This process was performed because of the need to use a normalized quantity for the sun zenith since it is located on the International Space Station (ISS) and not on a sun-synchronous orbit (as instead, PRISMA is).
Video 5 – Convertion into TOA Reflectance
Leader CNR
Short DescriptionDescribe algorithms and/or tools for the generation of water quality products
Completed May 2022
Outcome
This task aims to show the contribute of PRISMA and DESIS products for the water quality mapping of the PrimeWater freshwater reservoirs. The proposed techniques and the resulting products are shown in the following Table:
| Proposed technique | Bio geophysical parameters | Product |
|---|---|---|
| Semi analytical methods based on radiative transfer simulations parameterised with in-situ optical properties [BOMBER, (IDL script, free https://zenodo.org/record/5418571 ); MIP (commercial); semi-empirical methods band-ratios based approaches (IDL script a/o R scripts, free); Mixture Density Networks (MDN) codes and pretrained models (script free https://github.com/STREAM-RS/STREAM-RS ) | Chl-a [ug L-1], SPM [mg L-1], yellow substances or CDOM [m-1], Turbidity [NTU], Euphotic depth Zeu [m], Cyano-phycocyanin (CPC) [UNITS], cyano-phycoerythrin (CPE) [UNITS] | Water quality and phytoplankton |
| Classification and thresholding of selected hyperspectral features in VNIR to SWIR ranges, sensitive to association groups of macrophytes (IDL scripts, free). Semi-empirical modelling of macrophyte functional traits (LAI, Chl-a content) calibrated with in-situ data | Macrophytes characterization, status and coverage | Macrophytes |
| Calculation of the dominant wavelength (Matlab code, commercial) (CIE, 1932; Van der Woerd, 2015) | Color of water, as a water quality attribute in its own right with the advantage of intuitive meaning in public perception, dominant wavelength [nm] | Chromaticity, water color map |
Leader
CNR
Short Description
Comparison in terms of TOA Radiance and TOA Reflectance with respect to other optical satellite and in-situ data
Completed
May 2022 (depending on further acquisitions of satellite imagery this is an ongoing task, until the end of the project)
Outcome
This task is focused on the evaluation of PRISMA and DESIS L1 data.
PRISMA L1 data were evaluated in terms of TOA Radiance; instead, DESIS L1 data were evaluated in terms of TOA Reflectance (as explained in Task 3).
In the case of PRISMA, very good statistical results were obtained and reported in Giardino et al. (2020).
https://www.mdpi.com/1424-8220/20/16/4553
In the case of DESIS, from the comparison in terms of TOA Reflectance, good statistical results were obtained (overall RMSD= 0.017 and SA= 0.2). The examples of comparison with reference data are given in the next Figure.
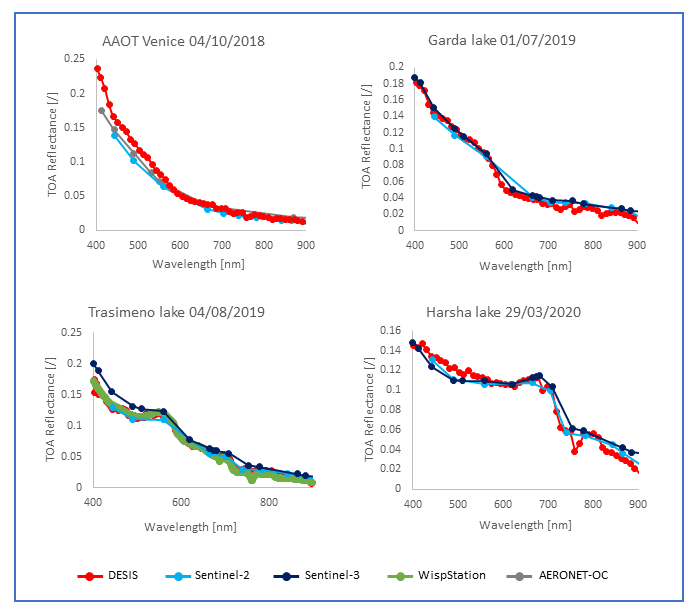
Figure 8 – Evaluation of DESIS L1 data
The evaluation of PRISMA and DESIS L1 products was completed by investigating them in terms of Signal-To-Noise Ratio (SNR). The results obtained are in line with the expected values for aquatic targets and they are comparable with the values obtained from Sentinel-2 (Pahlevan et al., 2017). In the following Figure, average values, with standard deviations, of SNRs values calculated in several PRISMA and DESIS images are plotted.
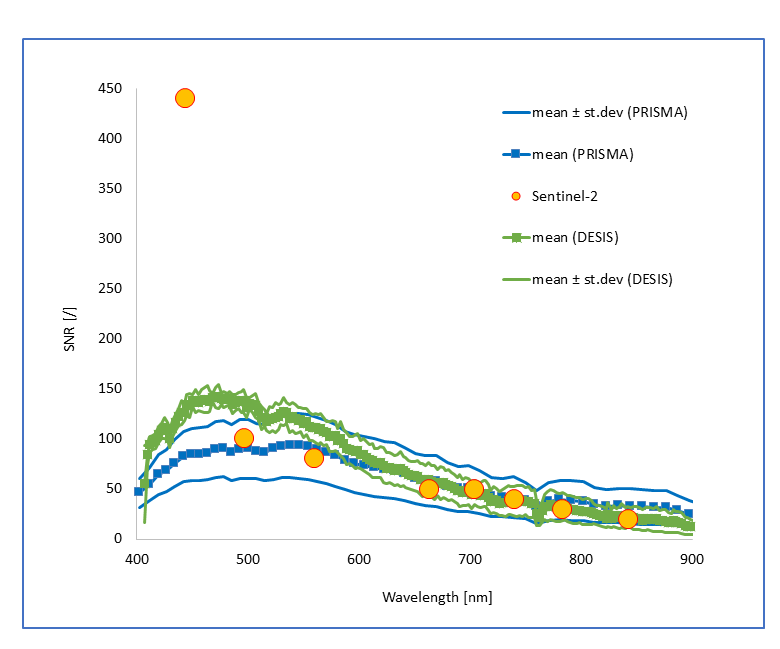
Figure 9 – SNR Evaluation
Video 6 – SNR Calculation
Leader
CSIRO
Short Description
Comparison of water reflectance from satellite data with corresponding measurements of in situ reference data
Completed
May 2022 (depending on further acquisitions of satellite imagery this is an ongoing task, until the end of the project)
Outcome
This task is focused on the evaluation of PRISMA and DESIS L2 data. In both cases, good statistical agreement with reference data resulted from the comparison (PRISMA: RMSD = 0.005 and SA = 0.31; DESIS: RMSD = 0.0027 and SA = 0.19). In the following Figure the evaluation of L2 data is shown.
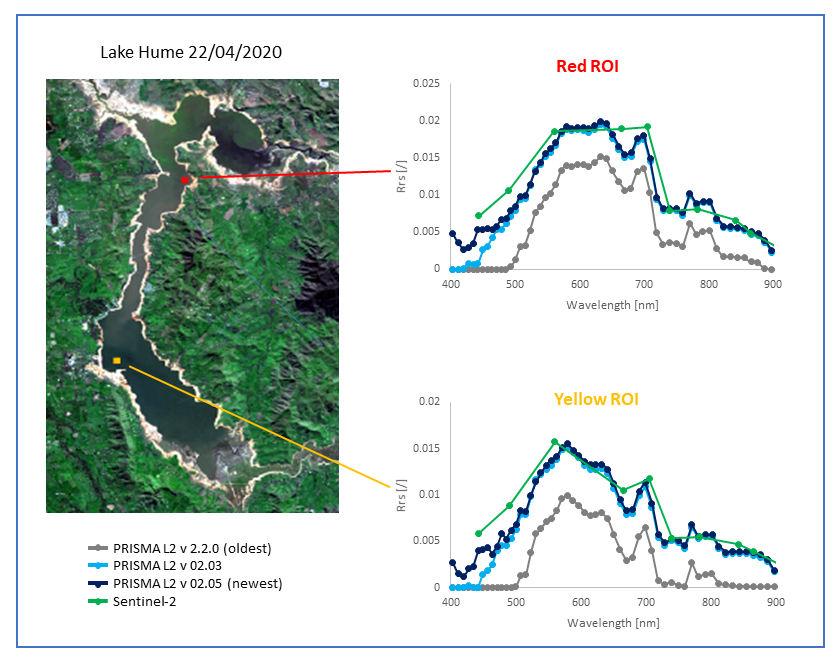
Figure 10 – Evaluation of PRISMA and DESIS L2 data
L2 data are provided from the atmospheric correction of L1 data carried out directly by the automatic processors of ASI and DLR. Since in the case of PRISMA, the automatic processor is continuously updated (check the Table below), comparisons were made between the different versions available.
| Processor version ID | Available since |
|---|---|
| v 2.2.0 | April 2020 |
| v 02.03 | January 2021 |
| v 02.04 | July 2021 |
| v 02.05 | October 2021 |
As a result of this analysis, a clear improvement of the products with the new versions was identified. An example is shown in the Figure below.
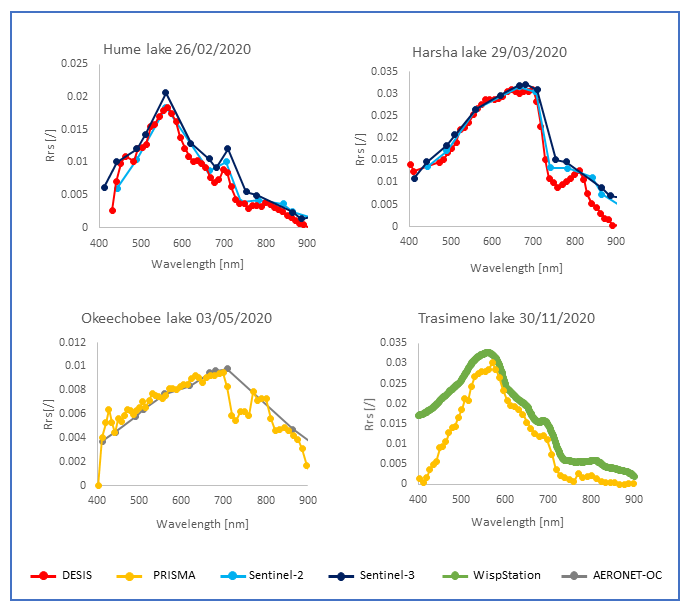
Figure 11 – Comparison of PRISMA L2 versions
Taking up the concept of SNR (presented in Task 5) also an estimate of the Noise of PRISMA and DESIS L2 data was carried out. From the results, it was possible to set a threshold according to Brando & Dekker (2003), identify the noisiest bands (usually in the blue region of the spectrum) and remove them in order to obtain more accurate products.
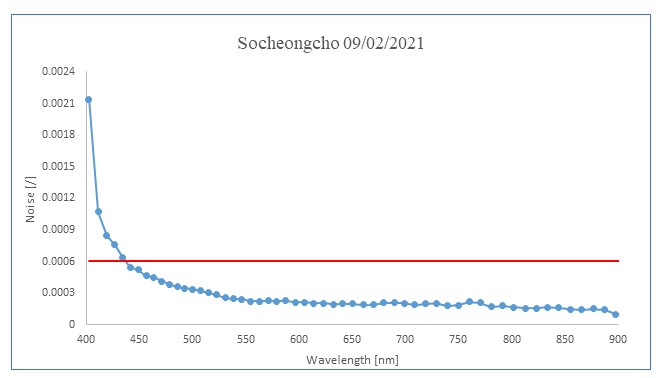
Figure 12 – Example of SNR calculation on PRISMA L2 data
Leader
CNR
Short Description
Task needed if L2 water Reflectance didn’t match in-situ a/o other satellite reference data
Completed
May 2022 (depending on further acquisitions of satellite imagery this is an ongoing task, until the end of the project)
Outcome
In the cases where the comparison of PRISMA and DESIS L2 with reference data did not show good agreement, an independent atmospheric correction of L1 was carried out, using ATCOR software.
ATCOR (Atmospheric and Topographic Correction) software is a physical method based on Radiative Transfer (RT) theory developed and distributed by ReSe ( https://www.rese-apps.com/software/atcor/) . ATCOR was configurated for running with both PRISMA and DESIS sensors and was run by providing different input information, such as:
• Solar zenith and solar azimuth;
• Sensor zenith and sensor azimuth;
• Aerosol Optical Depth (AOD) at 550 nm;
• Atmospheric profile description.
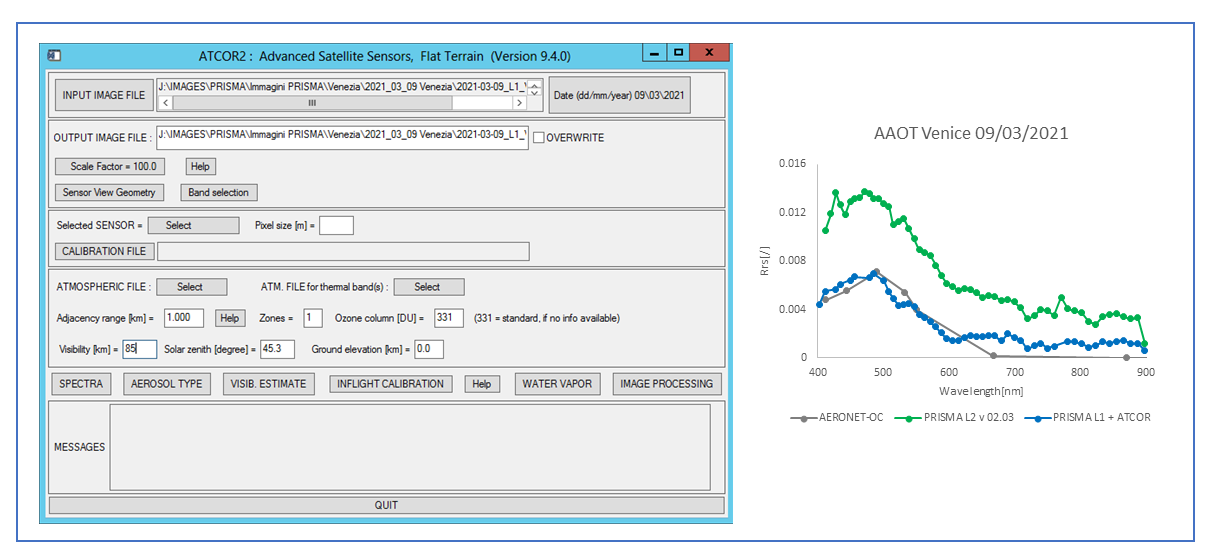
Figure 13 – Example of atmospheric correction with ATCOR
Ongoing: For PRISMA images, another atmospheric correction software is also being tested: ACOLITE, which is suitable for processing turbid waters and small inland water bodies but can be used with moderate success on clearer waters and on land. ACOLITE Python ( https://github.com/acolite/acolite ) includes two atmospheric correction algorithms, the default “Dark Spectrum Fitting” or DSF algorithm (Vanhellemont and Ruddick, 2018; Vanhellemont, 2019, 2020) and the older “Exponential extrapolation” or EXP algorithm. DSF provides aerosol and glint correction.
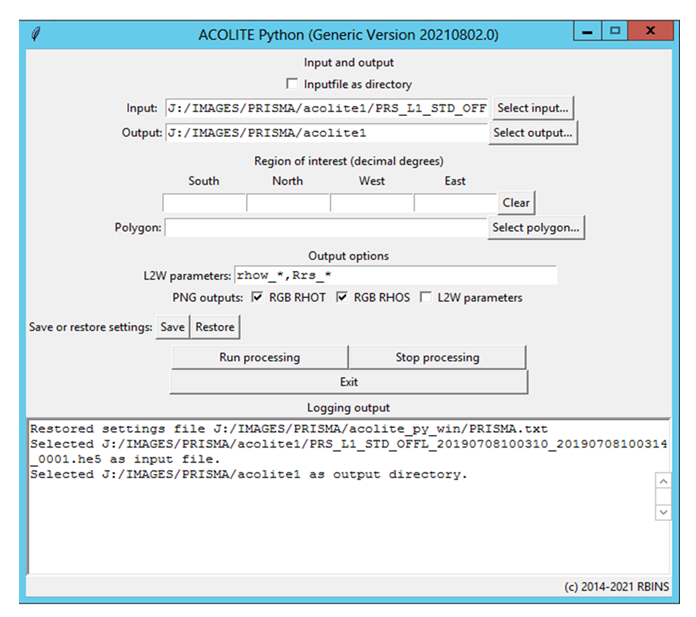
Figure 14 – ACOLITE interface
In addition to atmospheric correction, another type of correction was tested due to the Sunglint phenomenon, which compromises data quality. The aim of glint correction is to remove the contribution of direct reflectance from the top of the air-water interface from the images.
The DeGlint algorithm used in SNAP ( https://step.esa.int/main/download/snap-download/ ) software (within Sen2Coral plugin) is based on Hedley at al. (2005). After correction, a significant improvement in the comparison of spectral signature was noted in several cases.
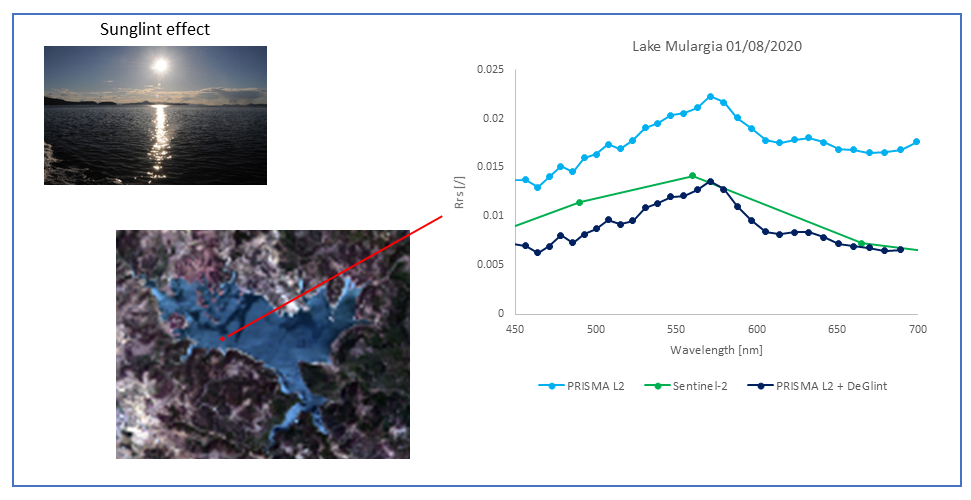
Figure 15 – Results of DeGlint process
Leader
CNR
Short Description
Tools allowing the retrieval of primary producers as defined in Task 4 used for mapping
Completed
May 2022 (depending on further acquisitions of satellite imagery this is an ongoing task, until the end of the project)
Outcome
PRISMA and DESIS products illustrated that hyperspectral sensors have a high potential to capture the presence of different constituents within a waterbody due to the high number of bands. In addition, hyperspectral products have successfully demonstrated that they can be used in synergy with established multispectral sensors (e.g., Sentinel-2 and Landsat 8) as they provide a significant improvement in quantitative value-added products that reflect the status and changes of various terrestrial and aquatic ecosystems. Examples of PRISMA and DESIS product maps obtained in the PrimeWater study areas are shown in the figure below while other examples can be found in Bresciani et al. (2022) https://www.mdpi.com/2079-9276/11/2/8 and in O’Shea et al. (2021) https://www.sciencedirect.com/science/article/pii/S0034425721004132 .

- Brando, V.E., & Dekker, A. (2003). “Satellite hyperspectral remote sensing for estimating estuarine and coastal water quality”. IEEE Trans Geosci Remote, 41(6), 1378–1387.
- Bresciani, M., Giardino, C., Fabbretto, A., Pellegrino, A., Mangano, S., Free, G., & Pinardi, M. (2022). “Application of New Hyperspectral Sensors in the Remote Sensing of Aquatic Ecosystem Health: Exploiting PRISMA and DESIS for Four Italian Lakes”. Resources, 11(2), 8.
- Bresciani, M., Pinardi, M., Free, G., Luciani, G., Ghebrehiwot, S., Laanen, M., … & Giardino, C. (2020). “The use of multisource optical sensors to study phytoplankton spatio-temporal variation in a Shallow Turbid Lake”. Water, 12(1), 284.
- CIE (1932). Commission Internationale de l’Éclairage Proceedings. Cambridge, UK: Cambridge University Press.
- Giardino, C., Bresciani, M., Braga, F., Fabbretto, A., Ghirardi, N., Pepe, M., … & Brando, V. E. (2020). “First Evaluation of PRISMA Level 1 Data for Water Applications”. Sensors, 20(16), 4553.
- Hedley J. D., Harborne A. R., & Mumby P. J. (2005). “Technical note: Simple and robust removal of sun glint for mapping shallow‐water benthos”. International Journal of Remote Sensing, 26:10, 2107-2112.
- Kotchenova, S.Y., & E.F. Vermote, E.F. (2007). “Validation of a vector version of the 6S radiative transfer code for atmospheric correction of satellite data. Part II: Homogeneous Lambertian and anisotropic surfaces”. Applied Optics, 46 (20), 4455-4464.
- Kotchenova, S.Y., Vermote, E.F., Matarrese, R., & Klemm, Jr., F.J. (2006). “Validation of a vector version of the 6S radiative transfer code for atmospheric correction of satellite data. Part I: Path radiance”. Applied Optics, 45 (26), 6762-6774.
- Nazeer, M., Nichol, J.E., & Yung, Y.K. (2014). “Evaluation of atmospheric correction models and Landsat surface reflectance product in an urban coastal environment”. International journal of remote sensing, 35(16), 6271-6291.
- Pahlevan, N., Sarkar, S., Franz, B.A., Balasubramanian, S.V., & He, J. (2017). “Sentinel-2 MultiSpectral Instrument (MSI) data processing for aquatic science applications: Demonstrations and validations”. Remote sensing of environment, 201, 47-56.
- Peters, S., Laanen, M., Groetsch, P., Ghezehegn, S., Poser, K., Hommersom, A., De Reus, E., Spaias, L. (2018). “WISPstation: A new autonomous above water radiometer system”. In Proceedings of the Ocean Optics XXIV Conference, Dubrovnik, Croatia.
- Van der Woerd H, Wernand M. (2015). “True colour classification of natural waters with medium-spectral resolution satellites: SeaWiFS, MODIS, MERIS and OLCI”. Sensors, 15(10):25663-25680.
- Vanhellemont, Q., & Ruddick, K. (2018). “Atmospheric correction of metre-scale optical satellite data for inland and coastal water applications”. Remote Sensing of Environment, 216, 586-597.
- Vanhellemont, Q. (2019). “Adaptation of the dark spectrum fitting atmospheric correction for aquatic applications of the Landsat and Sentinel-2 archives”. Remote Sensing of Environment, 225, 175–192.
- Vanhellemont, Q. (2020). “Sensitivity analysis of the dark spectrum fitting atmospheric correction for metre-and decametre-scale satellite imagery using autonomous hyperspectral radiometry”. Optics Express, 28(20), pp.29948-29965.
- Vermote, E.F., Tanré, D., Deuzé, J.L., Herman, M., & Morcrette, J.-J. (1997). “Second Simulation of the Satellite Signal in the Solar Spectrum, 6S: An Overview”. IEEE Transactions on Geoscience and Remote Sensing, 35(3), 675-686.
- Wei, J., Lee Z., & Shang S. (2016). “A system to measure the data quality of spectral remote-sensing reflectance of aquatic environments”. Geophys. Res. Oceans, 121, 8189-8207.
- Zibordi, G., Melin, F., Hooker, S.B., D’Alimonte, D., Holben, B. (2004). “An autonomous above-water system for the validation of ocean color radiance data”. IEEE Trans. Geosci. Remote Sens., 42, 401–415.
2 Comments
Leave a Reply
You must be logged in to post a comment.
[…] You can access these videos on PrimeWater YouTube channel or on our Virtual Lab page. […]
[…] You can access these videos on PrimeWater YouTube channel or on our Virtual Lab page. […]